

What the data says about the growth of resident-facing municipal information — and what it means for bond and capital improvement programs
Front Line Advisory Group | September 2026
The headline: Between 2015 and 2021, the share of cities with a platform and process to release data to residents rose from 18% to 67%. Over the same period, the share engaging residents around goals and communicating progress rose from 19% to 70%. [1]
Public expectations have changed. Residents increasingly expect to be able to see how public money is being spent, what projects are underway, whether schedules are holding, and what outcomes government is producing — without having to file a records request, attend a meeting, or call a department for an update.
Municipal dashboards sit directly at the intersection of those expectations. They can turn complex financial, schedule, project, and performance information into a public-facing source of truth. The available research does not provide a single national statistic for the percentage of constituents who specifically use municipal dashboards. But it does show a clear, measurable increase in governments publishing data, communicating progress, and experiencing greater resident engagement with digital information.
The numbers: municipal transparency and engagement are moving upward
| Indicator | Earlier | Later | Change | Source |
|---|---|---|---|---|
| Cities with a platform/process to release data to residents | 18% (2015) | 67% (2021) | +49 pts / 3.7× | What Works Cities / Deloitte |
| Cities engaging residents on goals and communicating progress | 19% (2015) | 70% (2021) | +51 pts / 3.7× | What Works Cities / Deloitte |
| Cities monitoring/analyzing progress toward key goals | 30% (2015) | 75% (2021) | +45 pts / 2.5× | What Works Cities / Deloitte |
| Local-government leaders reporting increased resident engagement | 52% (2021) | 85% (2023) | +33 pts | OpenGov / Zogby Analytics |
| Governments improving communication of data/insights to council & community | 76% (2021) | 83% (2023) | +7 pts | OpenGov / Zogby Analytics |
Important context: The What Works Cities figures describe cities participating in that network, and the OpenGov figures are based on surveys of local-government leaders. They are strong indicators of direction, not a census of every U.S. municipality or a direct count of dashboard users. [1] [2]

Figure 1. Growth in selected resident-facing municipal data practices, 2015–2021.
A nearly fourfold increase in releasing data to residents
The most striking change is the growth in structured public data release. Results for America reports that within the What Works Cities community, cities with a platform and process for releasing data to residents increased from 18% in 2015 to 67% in 2021. Public engagement practices also accelerated: cities engaging residents around goals and communicating progress rose from 19% to 70%, while cities monitoring and analyzing progress toward key goals rose from 30% to 75%. [1]
That matters because a dashboard is not simply a graphic. It is the visible endpoint of a larger management system: consistent data definitions, disciplined updates, schedule and budget controls, governance, and accountability. When those elements are working, the dashboard can give executives, elected officials, staff, and residents a common view of program performance.
Resident engagement is rising faster than government reporting
OpenGov’s 2023 State of Local Government Survey adds another dimension. The survey, conducted by Zogby Analytics with 592 U.S. local-government leaders, reported that the share of respondents seeing increased resident engagement rose from 52% in 2021 to 66% in 2022 and 85% in 2023. Over the same period, the share reporting improved communication of data and insights to councils and communities increased from 76% to 79% to 83%. [2]
The report’s conclusion is particularly relevant: resident requests for data and information about how government is performing were outpacing improvements in reporting and transparency. In practical terms, the public appetite for accessible information appears to be growing faster than many governments’ ability to provide it. [2]
Residents are not only asking for transparency — they are using the data
Philadelphia offers one of the clearest usage examples. In 2021, the City reported that its open-data program had attracted more than 600,000 unique visitors and more than 4 million pageviews since 2015. The City also reported increased engagement by unique users in nearly every year. Philadelphia had released 354 public datasets and created 58 visualizations at the time of the report. [3]
Those figures are broader than capital-project dashboards, but they establish an important point: public data is not merely an internal compliance exercise. When information is made accessible and usable, people actually engage with it for professional, community, and personal purposes. [3]
The trend is now embedded in capital improvement programs
For infrastructure owners, the shift is increasingly visible in the way major cities present capital and bond information. The City of Austin groups multiple interactive public tools under its “Key Data and Insights” resources, including Open Budget ATX, Capital Projects Explorer, Bonds ATX, Performance ATX, and its Community Survey Dashboard. Austin describes these tools as bringing together operational data and community input so residents can explore budget information, capital-project updates, bond-program progress, performance goals, and community feedback. [4]
San Diego has moved even further toward dashboard-based CIP transparency. Its public CIP site includes interactive tools that allow users to search active capital projects by address, council district, project number, or map location. Cost and schedule information is updated monthly, and the City expressly states that the dashboards are intended to provide public access as part of its commitment to transparency. [5]
That approach is reinforced by policy. San Diego’s Capital Improvement Program Transparency Policy establishes requirements for improving public access to CIP information, including project status, schedules, funding, changes, and other project data. The City’s FY2026 State of the CIP report notes that its redesigned CIP website uses interactive dashboards to provide timely and transparent project information. [6] [7]
A Texas example: Schertz turns project reporting into an on-demand public resource
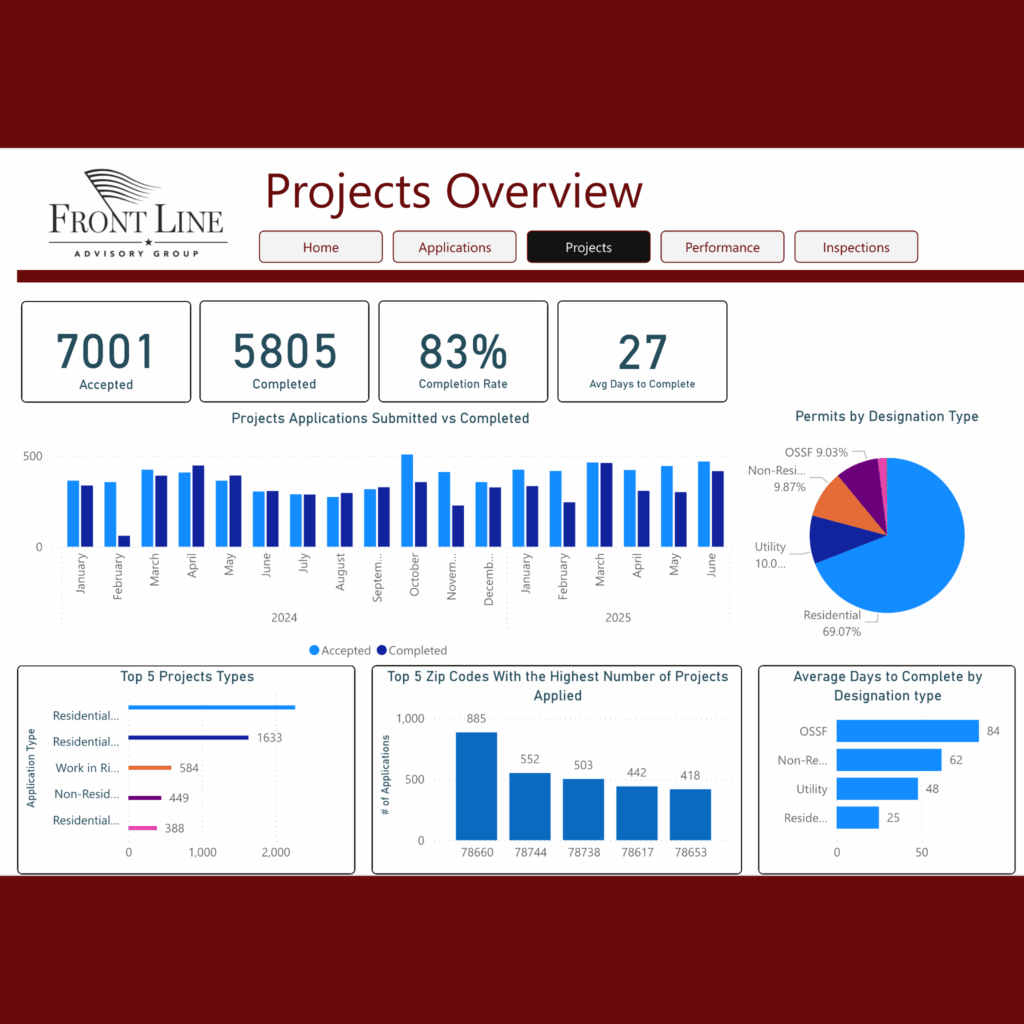
The City of Schertz, Texas, provides a particularly relevant example for municipalities managing capital improvement programs. According to Esri’s 2025 case study, Schertz developed a Capital Improvement Projects dashboard to reduce reliance on formal reports, scheduled meetings, and repeated phone calls for project information. The dashboard provides ongoing and future project information on demand and is designed to improve communication and transparency between city management and residents. [8]
The response is notable. Schertz Assistant City Engineer John Nowak reported receiving many compliments from both the public and elected officials about how easy the information was to access and how useful the dashboard was. The implementation was successful enough that other departments began working with GIS to develop similar dashboards. [8]
What this means for bond programs
Bond programs have an unusually strong case for public dashboards. Voters authorize a defined amount of public debt for a defined set of purposes, often delivered over many years. As projects move through planning, design, right-of-way, utility coordination, procurement, construction, and closeout, the underlying information becomes difficult for nontechnical audiences to follow through static reports alone.
A well-managed bond-program dashboard can make that complexity understandable by connecting: budget and expenditures; commitments and forecasts; schedules and milestones; cash flow; project status; geographic location; risks and changes; and the relationship between voter authorization and actual delivery. For elected officials, that creates faster oversight. For administrators, it creates a shared operating picture. For residents, it answers the basic accountability questions: What did we approve? What is being built? What has been spent? Is the program on schedule? What has changed?
The critical distinction: a dashboard is the output; program controls are the engine. A visually impressive dashboard built on inconsistent schedules, outdated budgets, disconnected spreadsheets, or unclear ownership can create the appearance of transparency without the substance. Reliable public reporting starts with disciplined program management.
The direction is clear
The evidence does not support saying that every resident now expects a dashboard, or that a specific percentage of constituents consult municipal dashboards. What the evidence does support is a more consequential conclusion: municipal government has moved rapidly toward releasing data, communicating progress, and giving residents direct digital access to performance and project information. At the same time, resident engagement and demand for government information have increased.
For capital and bond programs, dashboards are increasingly becoming part of the accountability infrastructure itself. The strongest implementations do more than visualize data. They create a common source of truth, reduce friction in answering routine questions, expose changes earlier, and connect public promises to measurable delivery.
The next standard for public infrastructure management is not simply to deliver projects. It is to deliver them with an information system that allows decision-makers and the public to see, understand, and evaluate the program as it unfolds.
Front Line Advisory Group (FLAG) is a Program Management Consulting (PMC) firm focused on delivering bond-funded infrastructure projects on time and on budget through disciplined management and data-driven controls. Our mission extends beyond consultation – we empower our clients to realize the full potential of their investments, ensuring tax dollars are put to maximum use through astute Program Management Consulting. For more information or to commence your journey towards transformative bond management, reach out to us at Info FLAG
References
1. Results for America / Monitor Institute by Deloitte / What Works Cities, “Closing the Data Gap: How Cities Are Delivering Better Results for Residents” (2021).Source link
2. OpenGov, “State of Local Government Survey 2023,” research conducted by Zogby Analytics; 592 U.S. local-government leaders.Source link
3. City of Philadelphia, “A new way to explore the City’s open data” (Nov. 15, 2021).Source link
4. City of Austin, “Austin Budget and Organizational Excellence — Key Data and Insights.”Source link
5. City of San Diego, “CIP Project Information.”Source link
6. City of San Diego, Council Policy 000-31, “Capital Improvement Program Transparency” (effective Sept. 22, 2022).Source link
7. City of San Diego, “FY2026 State of the CIP Mid-Year Report.”Source link
8. Esri / ArcUser, Alexa Venezia, “Dashboards Track Capital Improvement Projects in Schertz” (Fall 2025).Source link
Research note: Statistics are drawn from the cited studies and municipal sources. Different studies use different samples and definitions; figures should be interpreted as indicators of direction rather than a single national estimate of dashboard usage.