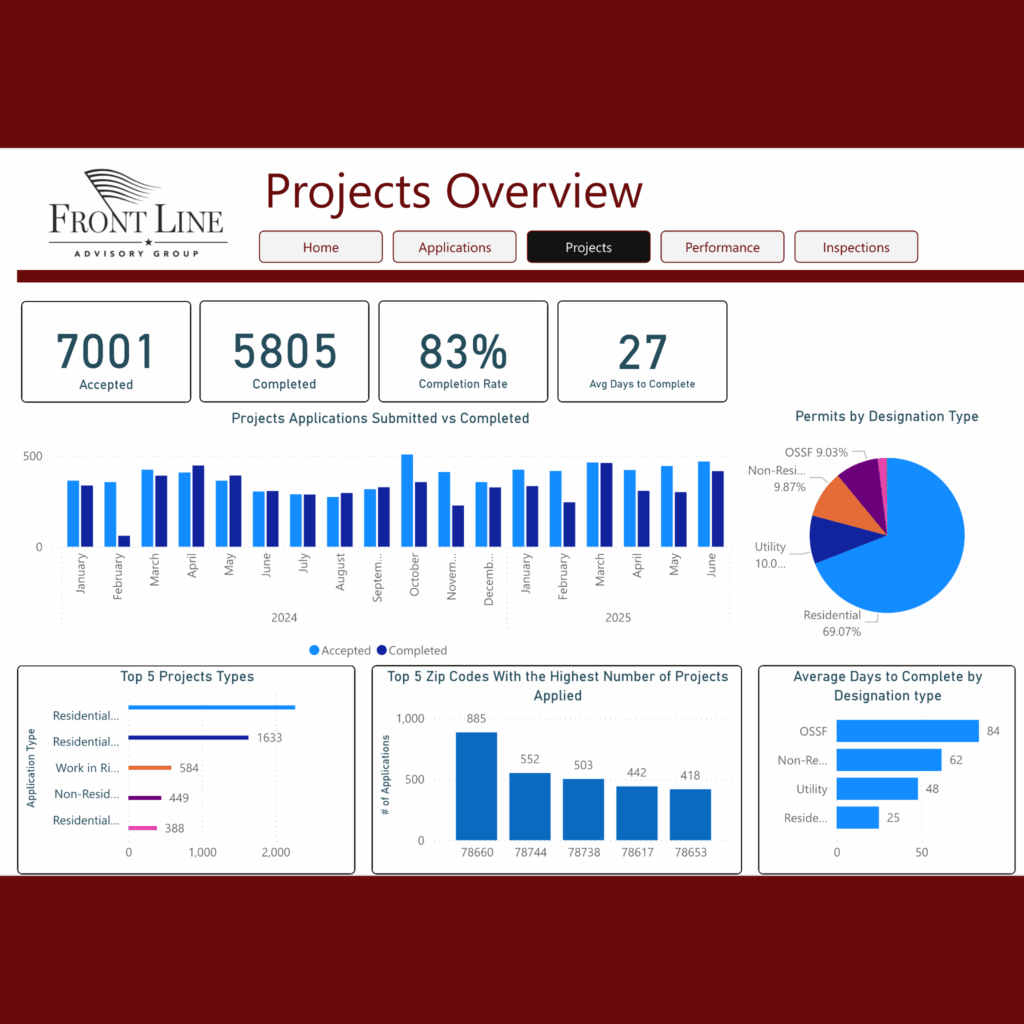


Designing Dashboards That Work: Best Practices for Planning Your Next Dashboard
Dashboards are an essential tool for organizations to monitor key metrics and make informed decisions, because they help organizations to organize, analyze, visualize, and track data. An effective dashboard should provide clear and concise information that is easy to understand. Three best practices for designing an effective dashboard is identifying the audience, keeping it simple, and using visualization.
Identify the Audience
Identify the intended audience before designing a dashboard. The audience can vary depending on the organization and may include executives, managers, analysts, or the general public. The dashboard should be designed with a particular audience in mind to ensure that it meets their needs and provides relevant information.
A marketing dashboard may have different metrics and visualizations than a financial dashboard for the same company. The marketing dashboard may focus on metrics for website traffic, conversion rates, and social media engagement, while the financial dashboard may have metrics for revenue, profit margins, and cash flow. By understanding the audience and their goals, the dashboard can be tailored to provide the most value.
Keep it Simple
A dashboard should be simple and easy to understand. The goal is to provide the necessary information without overwhelming the user with unnecessary data or clutter. The dashboard should highlight the most important metrics, avoid distractions that can lead to decision fatigue, and require little to no explanation to find valuable information.
A project management dashboard may focus on metrics such as project status, task completion rates, and bug resolution rates. Just because information can be shared does not mean it needs to be. Focusing on only the most critical metrics, the dashboard can provide a quick overview of the project’s health and identify areas that need attention, without the distraction of unneeded data.
Use Visualizations
Visualizations such as charts and graphs are an effective way to convey information in a way that is easy to understand. The visualization should be chosen based on the data being presented and the audience’s needs. A good visualization can highlight trends and patterns that may not be immediately apparent from raw data.
A customer service dashboard may use a stacked bar chart to show the distribution of customer complaints by category. The chart may show the number of complaints for each category, with each bar divided into segments representing subcategories. By using a stacked bar chart, the dashboard can provide a clear and concise overview of the most common complaints and their subcategories.
Designing an effective dashboard requires careful consideration of the audience, simplicity, and visualizations. By following these best practices and incorporating them into the dashboard design and planning, organizations can create a tool that provides valuable insights and aids decision-making.
At Front Line Advisory Group (FLAG), we are providing change management services to help municipalities collect and analyze data, improve stakeholder communication, leverage technology, develop training plans, and more. We believe these are the most effective and affordable ways for municipalities to scale their capabilities. Contact us for more info at info@frontlineadvisorygroup.com.