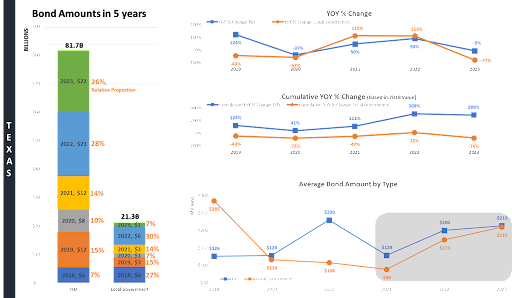
Over the course of the past five years (The period is November 2018 – May 2023), Texas has seen local governments, Independent School Districts (ISDs), and special districts issuing a collective total of $111 billion in bonds. Of these, ISDs have emerged as the dominant entities, accounting for 74% ($81.7 billion) of total bonds issued, while local governments trail behind at 19% ($21.3 billion).
In 2022, a noteworthy amount of bonds were sold, with 113 ISDs and 37 local governments participating in this action across Texas. This equated to 28% of all ISDs and 30% of all local governments issuing bonds.
An analysis of the year-over-year (YOY) percentage change shows no discernible upward trend in the issuance of bonds by ISDs and local governments. This invites a deeper exploration of the data via a comprehensive, slice-and-dice strategy to yield more substantial and reliable conclusions.
Nonetheless, when we turn our attention to the cumulative YOY percentage change, particularly for ISDs, we can observe a significant upswing in recent bond amounts issued compared to 2018. Notably, ISDs issued bonds in 2022 and 2023 amounting to approximately 300% of the total issued in 2018.
Moreover, a peculiar trend has surfaced since 2021, when examining the average bond amount. As detailed in the infographic box (located at the bottom right-hand corner), there was a notable surge between 2021 and 2022 (55% for ISDs and 96% for local governments). Though it appears to be decelerating between 2022 and 2023, the trend continues to climb.
Central Texas: A Closer Look at Bond Issuance
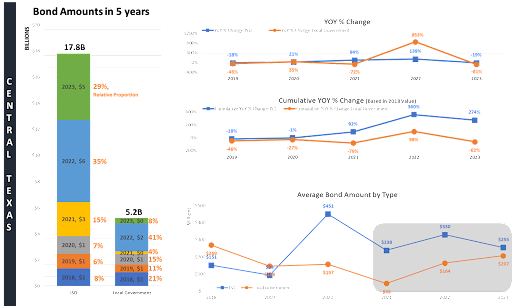
Within the context of Central Texas, local governments, ISDs, and special districts have issued a total of $24 billion in bonds over the past five years, accounting for 22% of the total bonds issued in Texas. Echoing the overall state trend, ISDs maintain their position as the principal issuers of bonds, releasing a total of $17.8 billion (75%), with local governments issuing bonds valued at $5.2 billion (22%).
In 2022, 14 local governments, a record number within the studied period, released substantial bonds amounting to $2.1 billion (41% of all bond amounts issued over five years). Meanwhile, 19 ISDs participated in the 2022 bond election and 20 ISDs took part in the 2023 bond election, with 67% of the ISDs listed in the Central Texas file participating in both elections.
Despite a significant rise in 2022, there is no upward trend in the YOY percentage change for both categories of agencies. However, much like the broader Texas trend, the cumulative YOY percentage change for ISDs in Central Texas shows a substantial increase from the amount issued in 2018 (around 300% of the 2018 figures).
From 2021 onwards, the average bond amount has shown a stable trend for ISDs, seeming to converge to a certain figure. In contrast, local governments have demonstrated a continual increase during the same period: a staggering 267% rise between 2021-2022 and a 26% increase between 2022-2023. To date, only the City of Round Rock and the City of New Braunfels have disclosed bond information, with more expected to follow by year’s end, potentially boosting this upward trend.
While it’s challenging to derive clear conclusions without more comprehensive control, there seems to be a slowdown in the pace of bond issuance by ISDs in the central region. Notably, 67% of ISDs participated in the 2022 and 2023 bond elections, and bonds passed during these elections accounted for 64% of the total amounts issued in the past five years.
As we culminate this analysis, it is fitting to highlight the five major players in bond issuance:
- Dallas ISD, which issued $3.7 billion in bonds, approved in November 2020
- Metro, with a total issuance of $3.5 billion, ratified in November 2019
- Harris County, which issued $2.5 billion in bonds, passed in November 2018
- Austin ISD, with a total issuance of $2.4 billion, approved in November 2022
- Northwest ISD, which issued $1.9 billion in bonds, passed in May 2023
This comprehensive analysis underscores the pivotal role of Independent School Districts (ISDs) in bond issuance within Texas over the past five years, with a particular emphasis on the trends seen in Central Texas. The absence of year-over-year growth, juxtaposed against the significant cumulative increases in bond issuance, particularly for ISDs, illuminates the complex dynamics of the bond market in this region. As this landscape continues to evolve, it’s crucial to maintain a watchful eye on these trends and their potential implications.
As we move forward, the bond market in Texas, especially in the Central region, will undoubtedly continue to provide a fascinating study in fiscal policy, public finance, and regional economics.
At Front Line Advisory Group, we are pioneers in Capital Improvement Bond Management, leveraging unparalleled expertise and deep industry insights. Our mission extends beyond consultation – we empower our clients to realize the full potential of their investments, ensuring tax dollars are put to maximum use through astute Program Management Consulting. For more information or to commence your journey towards transformative bond management, reach out to us at info@frontlineadvisorygroup.com
Data information provided by Kirk Yoshida at Strategic Partnerships, Inc. | www.spartnerships.com


