Share to:

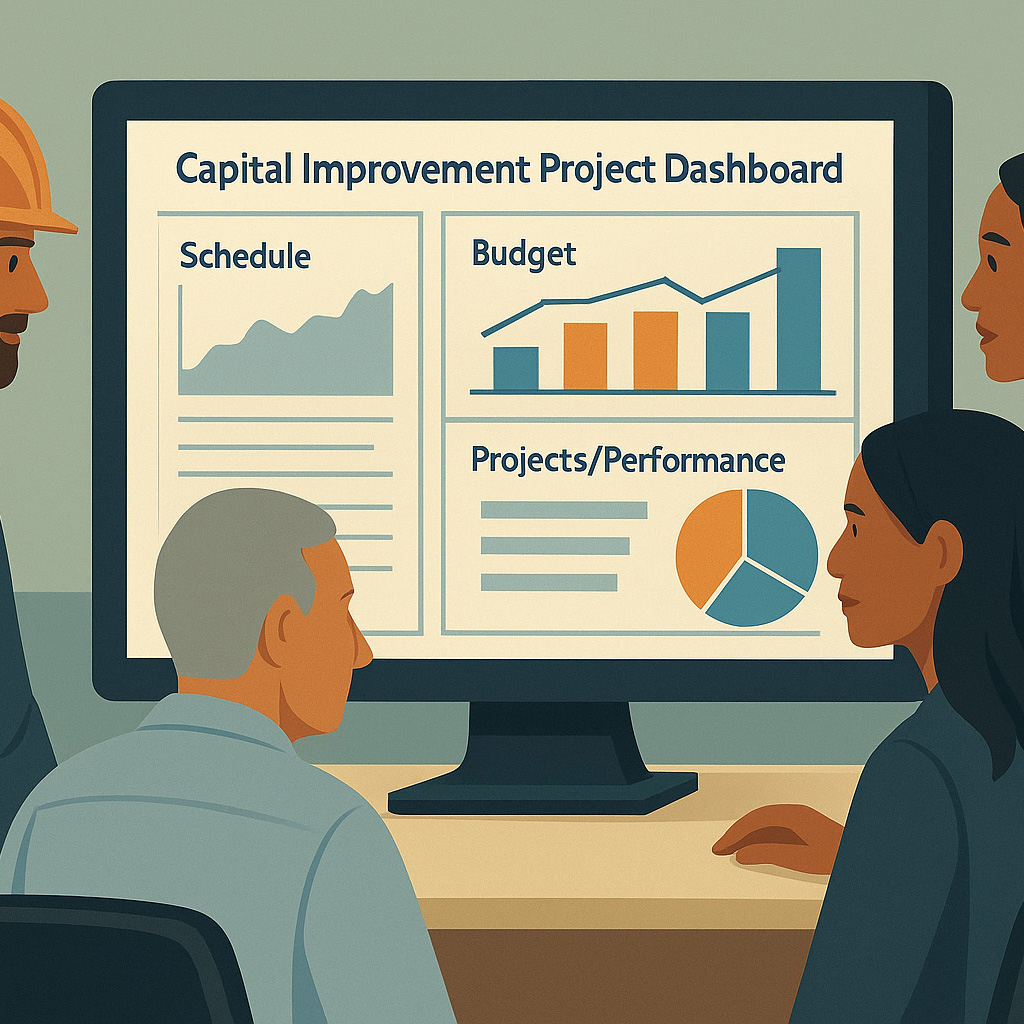
Designing Dashboards That Work: Best Practices for Planning Your Next Dashboard

Dashboards are an essential tool for organizations to monitor key metrics and make informed decisions, because they help organizations to organize, analyze, visualize, and track data. An effective dashboard should provide clear and concise information that is easy to understand. Three best practices for designing an effective dashboard is identifying the audience, keeping it simple, and using visualization.

Identify the Audience

Identify the intended audience before designing a dashboard. The audience can vary depending on the organization and may include executives, managers, analysts, or the general public. The dashboard should be designed with a particular audience in mind to ensure that it meets their needs and provides relevant information.

A marketing dashboard may have different metrics and visualizations than a financial dashboard for the same company. The marketing dashboard may focus on metrics for website traffic, conversion rates, and social media engagement, while the financial dashboard may have metrics for revenue, profit margins, and cash flow. By understanding the audience and their goals, the dashboard can be tailored to provide the most value.

Keep it Simple

A dashboard should be simple and easy to understand. The goal is to provide the necessary information without overwhelming the user with unnecessary data or clutter. The dashboard should highlight the most important metrics, avoid distractions that can lead to decision fatigue, and require little to no explanation to find valuable information.

A project management dashboard may focus on metrics such as project status, task completion rates, and bug resolution rates. Just because information can be shared does not mean it needs to be. Focusing on only the most critical metrics, the dashboard can provide a quick overview of the project’s health and identify areas that need attention, without the distraction of unneeded data.

Use Visualizations

Visualizations such as charts and graphs are an effective way to convey information in a way that is easy to understand. The visualization should be chosen based on the data being presented and the audience’s needs. A good visualization can highlight trends and patterns that may not be immediately apparent from raw data.

A customer service dashboard may use a stacked bar chart to show the distribution of customer complaints by category. The chart may show the number of complaints for each category, with each bar divided into segments representing subcategories. By using a stacked bar chart, the dashboard can provide a clear and concise overview of the most common complaints and their subcategories.

Designing an effective dashboard requires careful consideration of the audience, simplicity, and visualizations. By following these best practices and incorporating them into the dashboard design and planning, organizations can create a tool that provides valuable insights and aids decision-making.

At Front Line Advisory Group (FLAG), we are providing change management services to help municipalities collect and analyze data, improve stakeholder communication, leverage technology, develop training plans, and more. We believe these are the most effective and affordable ways for municipalities to scale their capabilities. Contact us for more info at info@frontlineadvisorygroup.com.

FLAG provides program management consulting services in Central Texas for municipal and school capital improvement bonds. FLAG is revolutionizing the construction industry and transforming client expectations by obsessing over the basics of budget oversight, schedule enforcement, compliance, vendor management, and stakeholder communication.

Join our weekly newsletter and receive a free copy of our new book!

JOIN NEWSLETTER

U.S. Department of Treasury. Best Practices for Financial Transparency in Public Sector Capital Projects. Retrieved from www.treasury.gov
Articles

U.S. Department of Treasury. Best Practices for Financial Transparency in Public Sector Capital Projects. Retrieved from www.treasury.gov

The Need for Standardized Accounting in Capital Improvement Bond Programs Capital improvement bond programs are the lifeblood of infrastructure development...
Read More
Building a Better Tomorrow: Insights into Galveston County’s $186 Million Bond Initiative
Articles

Building a Better Tomorrow: Insights into Galveston County’s $186 Million Bond Initiative

In February 2025, the Galveston County Commissioners Court unanimously approved a bond election totaling approximately $186 million, scheduled for May...
Read More
Future-Proofing Public Projects: Sugar Land’s Strategic Inflation Contingency in Bond Initiative
Articles

Future-Proofing Public Projects: Sugar Land’s Strategic Inflation Contingency in Bond Initiative

In November 2024, Sugar Land residents approved a comprehensive $350 million bond package aimed at enhancing public safety, infrastructure, municipal...
Read More
The Measurable Future of Construction: Data-Driven Success in the 21st Century
Articles

The Measurable Future of Construction: Data-Driven Success in the 21st Century

For decades, the construction industry has been the bedrock of economic development, shaping skylines and expanding infrastructure. Yet, while advancements...
Read More
Welcome to the 21st Century Construction Industry – If It Can’t Be Measured, It Can’t Be Managed
Articles

Welcome to the 21st Century Construction Industry – If It Can’t Be Measured, It Can’t Be Managed

The construction industry has long been synonymous with heavy equipment, hard hats, and on-site chaos. But as we stand in...
Read More
The Blueprint for Effective Program Management Controls
Articles

The Blueprint for Effective Program Management Controls

A well-structured Program Management Consultant (PMC) team focused on program controls should have the following key positions. Every position is...
Read More
“Finish Strong: Start Early” Why Early Documentation Handling is Critical
Articles

“Finish Strong: Start Early” Why Early Documentation Handling is Critical

The construction closeout phase marks the culmination of a project—a period where all remaining tasks are completed, and the project...
Read More
A Groundbreaking Vision: Inside New York’s Service-Disabled Veteran-Owned Business (SDVOB) Program
Articles

A Groundbreaking Vision: Inside New York’s Service-Disabled Veteran-Owned Business (SDVOB) Program

From the beginning, New York State’s Service-Disabled Veteran-Owned Business (SDVOB) program has been nothing short of groundbreaking. It was established...
Read More
The Increasing Relevance of Program Management Consultants (PMCs) in Capital Improvement Programs
Articles

The Increasing Relevance of Program Management Consultants (PMCs) in Capital Improvement Programs

The Increasing Relevance of Program Management Consultants (PMCs) in Capital Improvement Programs Program Management Consultants (PMCs) have emerged as key...
Read More
Transportation Report for Central Texas: 2024 Review and 2025 Outlook
Articles

Transportation Report for Central Texas: 2024 Review and 2025 Outlook

Central Texas is undergoing significant transformations in its transportation landscape, driven by legislative changes, extensive infrastructure projects, and advancements in...
Read More
1 2 3 22