

One Program, Two Dashboards: Why Internal and External Reporting Should Never Be the Same Screen
How infrastructure programs earn trust inside the building and out in the community
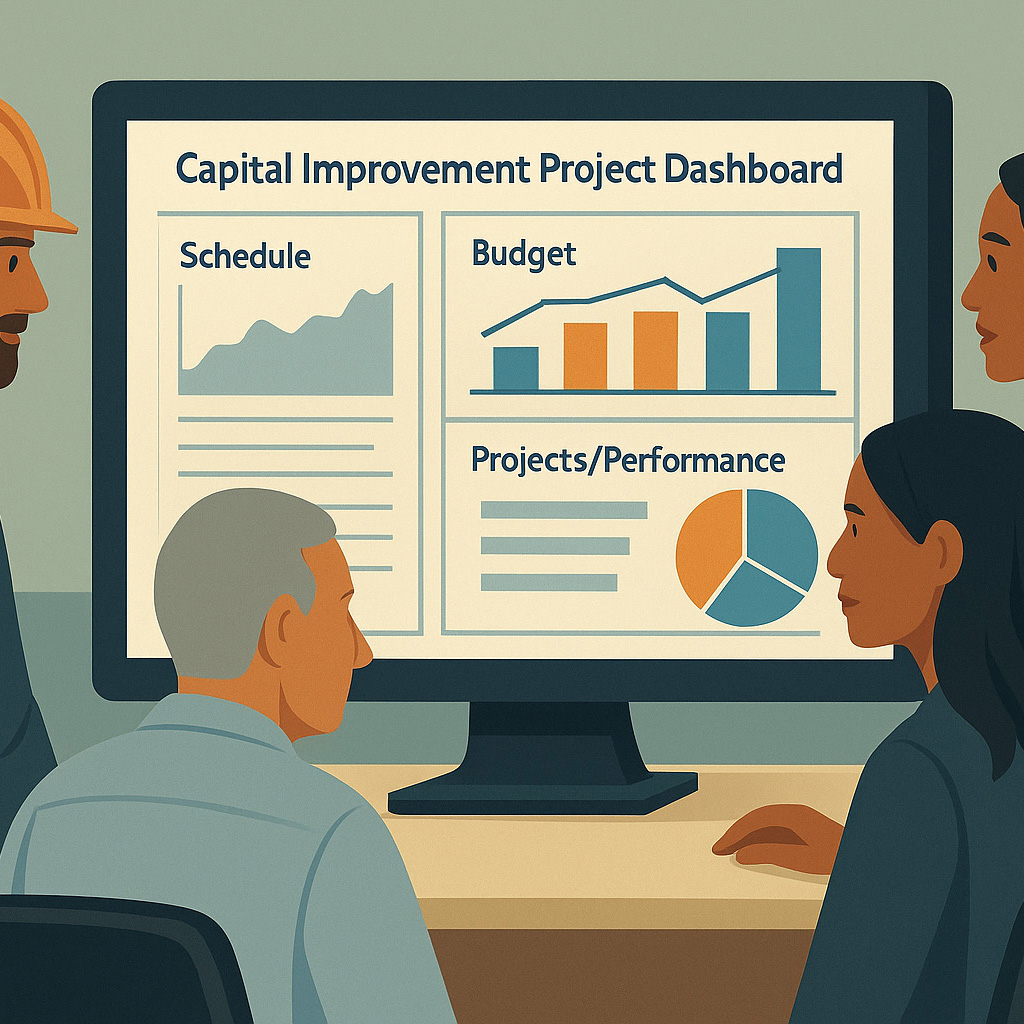
Every large infrastructure program eventually builds a dashboard. A bond program passes, a capital plan gets funded, dozens of projects start moving at once, and somebody says, “We need one place where we can see everything.” Fair enough. The trouble starts when that one place is asked to serve two very different masters: the people running the program and the people the program is for.
Those two audiences share a data source, but they do not share a question. The project manager wants to know why the drainage package slipped three weeks and whether the contingency can absorb the change order. The city council member, the school board trustee, and the taxpayer want to know something simpler and harder to answer: is this program keeping the promises that were made when the money was approved?
That is the real difference between an internal dashboard and an external one. It is not the color scheme or the software. It is who is asking, what they need to decide, and how much they should have to work to get an honest answer.
The internal dashboard: an instrument panel
An internal dashboard is a working tool. It exists so the program team can find trouble early and act on it before it becomes a headline. It should be dense, current, and unafraid of detail, because its readers already understand the context.
The best internal dashboards are built around leading indicators, the signals that predict a problem rather than confirm one. Schedule float burning down on a critical path. Committed costs closing in on budget before the work is half done. Submittals sitting unreviewed past their turnaround date. Change orders trending upward on a single contract. A cash-flow curve that has quietly fallen behind the plan. None of these mean a project has failed. All of them mean someone should look.
Because it is a diagnostic tool, an internal dashboard can and should show working numbers: forecasts that will change, estimates at completion that are still being negotiated, risk registers with items nobody outside the team needs to see yet. It should refresh often, ideally straight from the schedule, cost, and document systems, so the team is looking at reality rather than last month’s reconstruction of it. And it should be organized the way the program is actually managed, by work breakdown, by contract, by owner of the next action, so a reader can go from “something is yellow” to “here is who owns it” in a few clicks.
The internal dashboard fails when it is too polished. If the team is sanding down the numbers before they hit the screen, the tool has stopped being an instrument panel and become a brochure. Inside the program, discomfort is information.
The external dashboard: a promise, kept in public
An external dashboard is a communication tool, and its purpose is accountability. When voters approve a bond or a governing body adopts a capital plan, they are told what will be built, roughly when, and for roughly how much. The external dashboard is where the program shows its work against those commitments, in language and visuals that require no training to read.
That changes almost everything about how it should be built. The external view answers a small number of big questions clearly: What did we say we would deliver? What have we delivered? What is under way, and what is coming next? Are we on budget and on schedule at the program level, and if not, why, and what are we doing about it? Where can I see the projects near me?
The numbers on an external dashboard should be reconciled and approved, not live and provisional. That is not about hiding anything; it is about not publishing a forecast on Tuesday that changes on Thursday and then having to explain the difference to a reporter. A monthly or quarterly cadence, tied to the same figures presented to the board or council, keeps the public view consistent with the official record. Progress should be shown at the project and program level, with plain-language status, milestones people recognize (design complete, construction started, open to the public), and a map, because most residents think in places, not in project numbers.
The external dashboard fails in the opposite direction from the internal one. It fails when it is too dense, when it exports the team’s working view straight to the public and expects a resident to interpret earned-value curves and float. It also fails when it is too rosy. A public dashboard that only ever shows green loses credibility the first time a local news story shows a project that is obviously behind. Trust is built by explaining a delay before someone else discovers it.
Same data, different disciplines
It helps to see the two side by side.
| Internal dashboard | External dashboard | |
|---|---|---|
| Primary audience | Program managers, project controls, PMO, finance, executives | Elected officials, residents, taxpayers, media, oversight committees |
| Core question | “What needs my attention this week?” | “Is this program keeping its promises?” |
| Level of detail | Task, contract, and line-item level; leading indicators | Program and project level; lagging, verified outcomes |
| Refresh cadence | Daily to weekly, often live from source systems | Monthly or quarterly, aligned to reporting cycles |
| Data status | Working numbers, forecasts, and open items | Reconciled, reviewed, and approved figures |
| Design goal | Density and speed of diagnosis | Clarity, context, and trust at a glance |
| Failure mode | Too little detail to act on | Too much detail to understand |
The most important line in that table is the last one. Internal dashboards go wrong by hiding detail; external dashboards go wrong by drowning people in it. Trying to satisfy both audiences with one screen almost guarantees you will do both.
Why they still have to be built together
None of this means the two dashboards should live in separate worlds. The strongest programs treat them as two views of a single, well-governed data foundation. The project management information system holds the schedule, the budget, the commitments, and the documents once. The internal dashboard reads from it continuously. The external dashboard reads from it on a controlled cadence, after review and sign-off. When a number appears in public, it can be traced back to the same source the team was managing against all along.
That discipline pays off in a few specific ways. Consistency: the figure on the public site matches the figure in the board packet, which matches the figure the program manager saw last week. Speed: when a council member asks a hard question, the team can answer from the internal view in minutes rather than assembling a slide deck. And credibility: when the external dashboard eventually has to show a delay or an overrun, the explanation is already understood internally, because the internal dashboard surfaced it months earlier.
A practical starting point
If your program is standing up reporting for the first time, or trying to fix reporting that is not working, a few principles go a long way.
- Decide the audience before the design. Write down who reads each dashboard and what decision they make with it. If the answer is “everyone,” you are building neither.
- Build one data foundation. Standardize the breakdown structures, coding, and update cycles first. Two dashboards on top of two spreadsheets is how numbers stop matching.
- Let the internal view be uncomfortable. Leading indicators, forecasts, and open risks belong there. That is where problems should be found.
- Let the external view be clear. Fewer metrics, plain language, recognizable milestones, a map, and a short note explaining anything that is not on track.
- Publish on a rhythm, not on impulse. Tie the public update to the official reporting cycle so the numbers residents see are the numbers leadership approved.
An infrastructure program is, at heart, a set of promises made in public and kept in private, one contract and one pour at a time. The internal dashboard is how the team keeps those promises. The external dashboard is how the community sees that they were kept. Build them differently, feed them from the same truth, and each one makes the other stronger.